
Every DBA responsible for database performance needs a set of tools for historical workload analysis to understand the cause of system degradation and, hopefully, prevent it from recurring. A similar set of tools might be needed for performance optimization tasks when the DBA discovers what needs to be optimized. For PostgreSQL, the extension pg_profile is a simple historical database workload profiler. In this article, I will demonstrate how pg_profile provides extended performance statistics and streamlines the ability to understand performance incidents.
Most DBAs use monitoring tools to review the performance of their Postgres database and the server it is running on over extended periods of time. These monitoring tools provide basic metrics regarding the CPU, memory, disc utilization, number of transactions, locks, and many other characteristics of the system. However, this information is insufficient for answering several questions, such as which workload is causing the heaviest resource utilization, which statements demand additional resources for execution, or whether an application is running some queries too often or perhaps requesting an unusually high amount of data from the database.
To answer such questions or investigate an obvious performance slowdown reported by a user complaint, DBAs have a couple of choices. One approach is setting up detailed logging for further log analysis. While this approach provides access to a tremendous amount of detail, analyzing all that data is difficult and time-consuming.
IPC NEWSLETTER
All news about PHP and web development
Another approach is using server statistic views analysis, that is, setting up Postgres Statistics Collector views with pg_stat_statements and pg_stat_kcache extensions. This approach enables tracking all queries without intensive server log generation, providing the ability to easily catch frequently called fast queries. It also tracks database object statistics, and there is no need to analyze huge log files. However, there are some downsides to this approach as well. It does not reveal the exact parameter values that cause long query execution, and there is no way to get the exact execution plan of a statement.
What is pg_profile?
pg_profile is a convenient way to conduct server statistic views analysis. It collects the data from Postgres Statistics Collector and extensions on a regular basis, providing a means to detect most resource-intensive activities for defined time periods in the past. The pg_profile extension was developed using pure pl/pgsql, that is, it has no binaries/libraries, services, etc. This makes it easy to install, and it can be used in restricted environments without access to the server file system. Since one or two samples per hour is usually sufficient to detect the most resource-consuming activities, pg_profile doesn’t create much overhead. Reports can be built between any two samples.
pg_profile enables a DBA to set a specific time interval, for example two hours, and create a report showing many performance statistics for that time interval. pg_profile also provides a differential report comparing performance statistics for two time periods side-by-side. This can help DBAs see specific differences in resource consumption that occurred during a time period with a performance issue and a time period with no such issue.
It is important to keep two things in mind with pg_profile. First, pg_profile must already be installed and taking regular samples when an incident occurs. Second, pg_profile does not provide any answers or draw any conclusions. The DBA must have sufficient knowledge of Postgres to analyze a report and locate the cause of the performance incident.
Running pg_profile
Running pg_profile is straightforward.
- Extract the extension files into your Postgres extension folder.
- Create extensions dblink and pg_profile.
- Set up a cron-like tool to perform pg_profile samples with the desired frequency.
Using pg_profile
The contents of a pg_profile sample is extensive and includes:
- pg_stat_database
- pg_stat_tablespaces
- pg_stat_all_tables pg_stat_all_indexes
- pg_statio_all_tables
- pg_settings
- pg_stat_bgwriter
- pg_stat_archiver
- pg_stat_wal
- pg_statio_all_indexes
- pg_stat_user_functions
- pg_stat_statements pg_stat_kcache
This information enables pg_profile to produce a broad report with the following content:
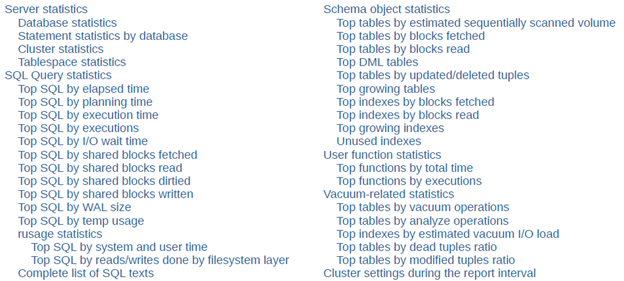
Based on a workload data set collected by pg_profile, DBAs can also build a report containing a summary of the most significant database activities during the interval between any two samples. This report contains the following sections:
- Server statistics – cluster-wide statistics of a Postgres instance
- SQL Query statistics – SQL statement lists sorted by various criteria
- Schema object statistics – table and index statistics sorted by various criteria
- User function statistics – user function execution statistics sorted by time and calls
- Vacuum-related statistics – statistics on tables and indexes influencing vacuum process
- Cluster settings during the report interval – Postgres instance parameters and their changes that were detected in samples

A standard report
A pg_profile report is an html file. To produce a report, simply call the get_report function, providing the samples or times bounding the required interval:
$ psql -Aqtc "SELECT profile.get_report(480,482)" -o report_480_482.html
The report can be opened in any web browser. The following are some sample report sections.
Statements by execution time
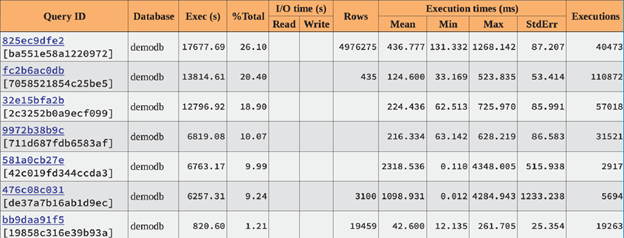
This report shows that only the first three queries consumed 65% of overall cluster execution time. They are the first to optimize.
Top SQL by shared blocks fetched
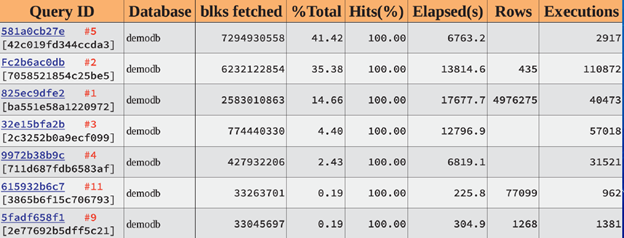
The red label here is a query rank in a previous table (by execution time). It is given for reference and won’t appear in a real report. We can see that our time-consuming queries are in leaders by data blocks processing. Also, we’ve discovered query 581a0cb27e consuming 41% of blocks processing in a cluster. 100% of Hits means that those queries are not causing file system reads.
Top tables by blocks fetched
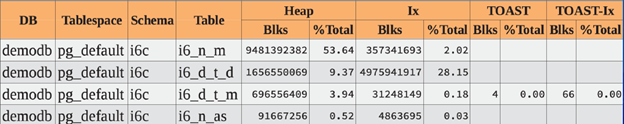
This shows top block processing tables and indexes. 93% of blocks fetched was performed from only two tables and their indexes. We will need to look closer at those tables to ensure we don’t have unnecessary queries from applications to those tables.
Top indexes by blocks fetched
Here we can see specific indexes by blocks fetched that were not seen in a table-related section.
By analyzing these reports, a DBA can determine that:
- The leading three statements consumed 65% of time and 91% of blocks
- The leading two tables with indexes consumed 93% of blocks
We now know the exact statements and tables responsible for time and block consumption in our database and where the optimization efforts should be applied.
IPC NEWSLETTER
All news about PHP and web development
A differential report
When a database experiences sudden performance degradation, a DBA can use a differential report to start the investigation. This report can provide information about the workload change between two time intervals, for example, the same time interval for two different days. The report then displays the statistics for the same objects side-by-side, with the first interval values in red and the second interval values in blue.
For example, to compare the time period “11:00-13:00 today” (when the issue is in progress) with the same time period “yesterday” (when system performance was normal), run the following command, providing appropriate time bounds:
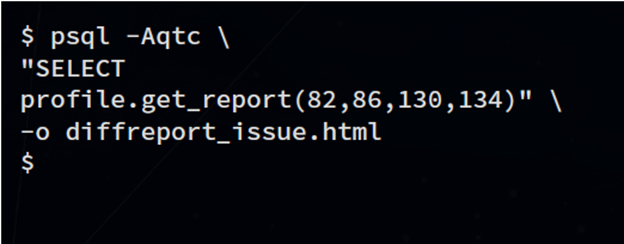
The report then shows the statistics for both time periods.
Database statistics
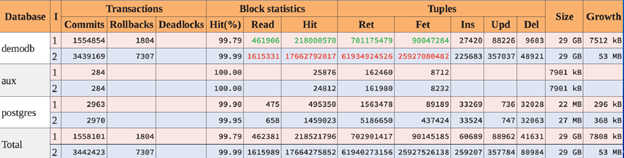
Green and red highlighted values indicate several orders of magnitude workload increase for the second interval in terms of the blocks and tuples statistics. At the same time transactions rate was only doubled.
Top SQL by execution time
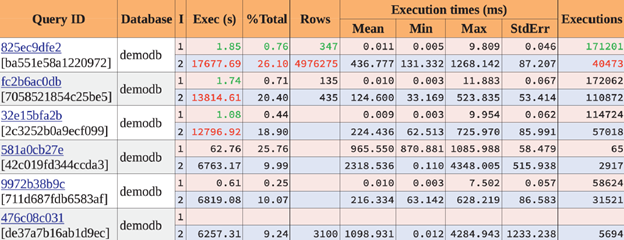
Let’s go deeper. We can see that the top three queries were performing much more slowly during the second time interval. They were consuming much more time for nearly the same execution count. Also, the first query affected many more rows during the second interval. Perhaps something changed in the application that could change the returned row count.
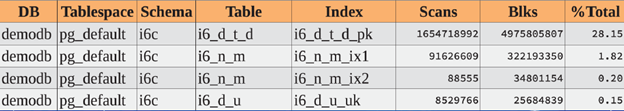
Top tables by blocks fetched
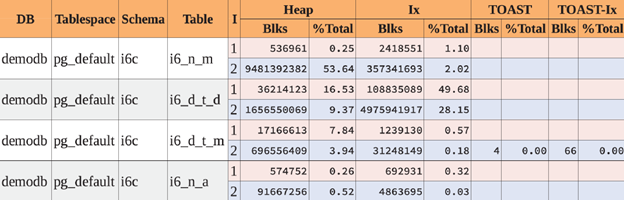
Table i6_n_m definitely has an issue. This is the only table having a huge workload increase in terms of blocks fetched.
Analyzing these reports, we can determine that:
- The leading statements executed 4 orders of magnitude longer
- The slowest query returned 4 orders of magnitude more rows
- There are 4 orders of magnitude more blocks obtained from the top table
Again, we now know the exact objects and statements related to our issue.
Conclusion
While pg_profile cannot explain why there was a degradation in performance, it is a great resource of information to help DBAs answer that question. It is also extremely easy to use with low overhead and requires only a Postgres database and scheduler to use. And work on pg_profile isn’t finished. New reports will be incorporated into pg_profile in the future.