
With the relaunch of a new website or a new version of a web application, it is often the case that you are only going to have an application at your disposal, which is sufficient enough to perform a load test, just in time for the relaunch. It is then for the sake of simplicity, and also because we did not schedule enough time for this in the first place, that we fall back on simpler tools, such as ab (Apache Benchmark) or siege. Both tools allow you to call a single URL, often and in parallel, and also give you a first indication of the website’s response time. The result of both tools is simple numbers that are easy to communicate: Requests per second and minimum, maximum and average response times.
However, in most cases I advise against taking such a seductively easy way. None of the problems, which I found with the realistic customer load tests, would have been uncovered this way and the mentioned numbers are actually quite limited in their significance. The same does also apply to the problems, which caused a failed relaunch. And on the other hand so far, I could ensure it to 100 percent through load tests, that the expected load was mastered by the tested website. How exactly can this be achieved?
Realistic user scenarios
The first and probably most important aspect is the realistic user scenarios. This does propose the question, as to what it is, what the website is used for. This means that we have to ask which actions are usually performed by the visitors and in what kind of ratio these actions stand to each other.
Using the example of an online shop, this could be the following scenario for example:
- An anonymous random-browser
- A new customer log in
- A logged in random-browser
- A check-out of a filled shopping cart
Additionally, depending on the online shop, other relevant user scenarios may also occur, for example if popular configurators exist or notepads play an important role. For each scenario it should be known how high the share of this scenario in the total traffic of the website is. These figures are sometimes difficult to estimate, because it is not necessarily possible to assess user behavior perfectly after a relaunch, a new website or even during an advertising campaign. However, the utilization of previous figures or customary figures from one’s own business area usually provides a sufficiently accurate estimate.
Why these scenarios?
Caching is the primary reason for using realistic scenarios. This does not only mean the own caching in the web application or in reverse caching proxies (varnish, nginx), but also the caching of various layers, which are not directly under your control, such as database servers, opcode caches or kernel caches. If, as it is the case with ab and siege, a small number of consistent URLs is called again and again, all these layers can store the corresponding data in the memory very easily and efficiently. Unfortunately, this behavior does not correspond to the expected behavior of real users, so these tests have no significance.
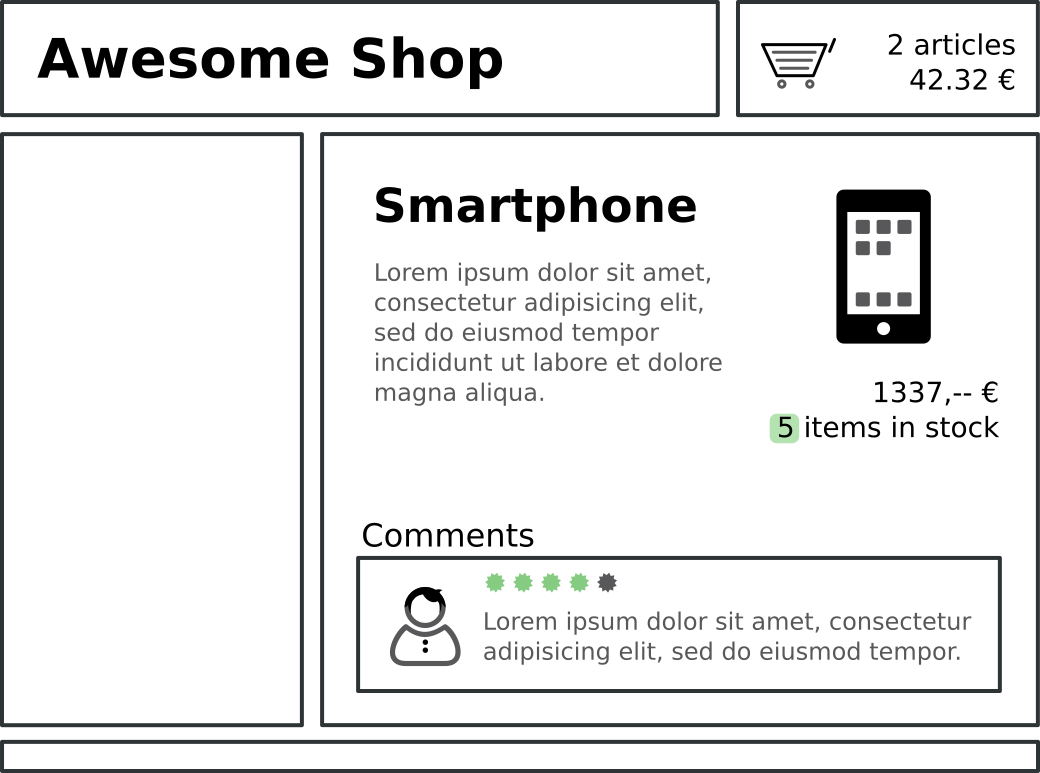
If you look at the simple schematic representation of an online shop in Figure 1, today such a shop consists of many components, which often have their own cache runtimes and contexts. While the header and navigation are often comparatively static, comments do change when they are released; product descriptions change when new data comes from ERP and the product inventory changes when products are sold. Elements such as the shopping cart are even directly linked to the user and are usually not cached at all.
Often, either reverse caching proxies with Edge-Side Includes (ESI) are used to cache such individual components or this takes place directly inside the web application. Even if all this is not the case, database servers cache the same queries, or the kernel caches requests to always the same files. However, the calculation or recalculation of content is exactly the action that costs the most resources on the server, so that it has the greatest effect on the load of the systems and must be simulated as realistically as possible.
For this reason, scenarios like the above are designed and must be executed in parallel with different users and sessions. This causes cache misses in all systems, caches are recalculated and possible cache hits sink to a normal level.
Number of calls
If you know the user scenarios, you also have to know in which number you can run them in parallel. Basically there is of course the possibility to set the number of parallel users higher and higher until the own servers collapse under the load. However, it usually makes more economic sense to understand how many users are expected in order to optimize the servers accordingly. It has to be taken into account that the users of most websites are not evenly distributed over the day, but there are specific core times that should be simulated.
For example, if in a German online shop with a core time of 18:00 to 22:00 only 240 000 page impressions (PI) per day is known, we should not aim to simulate 10 000 PI/hour (1 request/second), but probably more 40 000 PI/hour (3 requests/second). Because of a lack of equal distribution in normal user behavior, a simulation of 5 requests/second is probably the safest option in this case. In the best case, access logs are available, which help to find out not only the meaningful number of requests per second, but also the distribution to the individual user scenarios.
JMeter
There are now several tools and frameworks, besides ab and siege, which can perform meaningful load tests on the basis of realistic user scenarios. For example Apache JMeter, which is already very long on the market, freely available, Open Source and it is functionally very complete. Even if the creation of the user scenarios normally takes place via a user interface that requires getting used to, in my opinion this is still the most sensible tool for carrying out larger and realistic load tests.
JMeter allows automatic remote control of tests, can use clusters of servers to generate the necessary load (which is rarely necessary), and implements all conceivable protocols besides HTTP(S) to test special web applications. At the beginning you have to get used to the names for the individual concepts – but it has been shown that they can be used to create meaningful and reusable tests:
- Thread group: A thread group is exactly a user scenario as described above. For example, there may be a “Random Surfer” thread group in which we simulate a search engine bot or an unregistered user.
- Timer: A timer defines the intervals between several actions in a thread group. This is more important than you think, because real users don’t always wait exactly the same time between two clicks. Usually the click intervals of users are distributed in a Gaussian normal distribution around a defined value. In JMeter there is a configurable Gaussian Timer for this purpose.
- Controllers: Controllers allow you to implement logic, such as decisions or loops, based on variables or input values.
- Configuration elements: Data is provided via configuration elements. This can be a cookie manager or sample data from a CSV file to provide JMeter with existing user data in the test system for log-ins.
- Sampler: The samplers perform the actual requests based on the elements mentioned above. For Web pages, these are usually HTTPS requests. JMeter also supports FTP, SOAP and many other protocols.
With these elements, even more complex interactions such as forms to fill out or XMLHttpRequest-based website interactions can be simulated completely without any problems. Relatively simple and common tasks, such as reloading images and other assets or managing session cookies for individual users, are performed by JMeter itself.
However, it does not support an interpretation of JavaScript on the website and the theoretical automatic simulation of the use of a single page application. JMeter can be easily clustered to generate a very high load and aggregate the results in a meaningful way.
To measure correctly
At the beginning it was said that ab and siege provide simple and easily communicated numbers, like requests per second and the average response time. Of course JMeter does this too, but the significance of these numbers is rather limited. What I see as more significant are the following things:
- Error rates: The number of errors (status code ⋝ 500) that individual systems return. Especially at high load these often occur more frequently and require a more detailed analysis.
- 95 % percentile: 95 % percentile is the response time, for which more than 95 percent of all responses are faster. This number is much more relevant than the average of all response times, because it provides an estimate of how long users actually have to wait and better ignores individual outliers (minimum, maximum). In addition, other percentiles like 50 percent, 90 percent, 98 percent and 99 percent, are often considered. These can be calculated correctly from the data supplied by JMeter.
- Requests per second: We actually only look at the requests per second to determine whether the notified number of requests was actually reached by us in the load test.
In addition to these statistics, there is another crucial point in measuring: We usually want to know not only whether the website can withstand the load, but also which systems reach their limits and in what way.
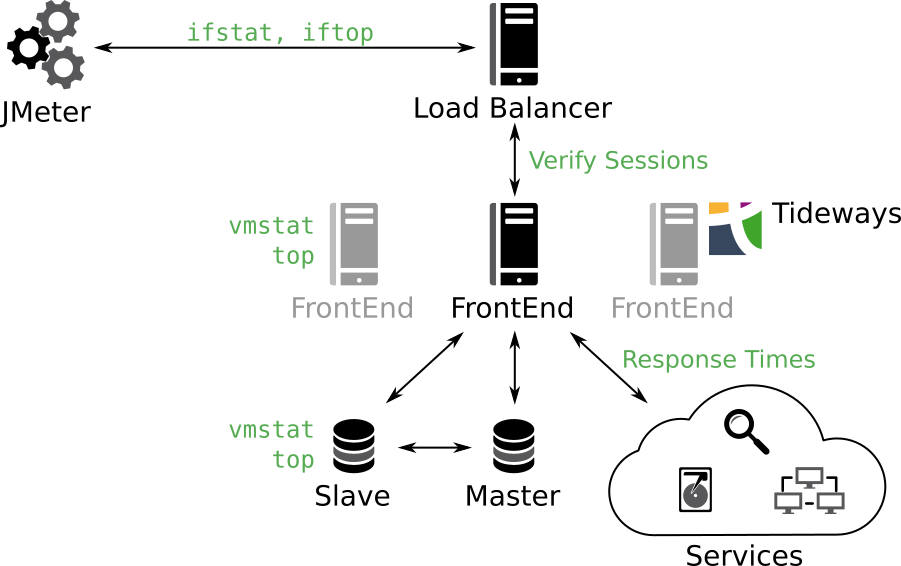
In Figure 2 you can see a schematic and simplified server landscape of web applications. At all relevant interfaces and on all systems we should try to measure, where the respective bottlenecks are. Network throughput can usually be easy monitored with ifstat or iftop. The most important system metrics, such as memory utilization, IO wait and system load can be obtained from vmstat. From external systems you want to measure at least the response times, if you don’t use monitoring solutions like Tideways, which do that for PHP code anyway. Depending on the service, further dedicated monitoring solutions like Tideways, New Relic or App Dynamics may be required.
After analyzing all this data together, in most cases you can already very accurately conclude the causes of possible performance problems. For this it can be profitable to put together your own experts from operations and development or to call in external experts.
Tips and tricks
External services are mentioned for the first time in Figure 2, and of course the response times under load should also be observed here. Under external services we understand simple components such as mailers, but also external or own web services (Microservices), which are integrated into our own application. In the case of external web services, the operators should always be informed about an upcoming load test. It would not be the first time, that a load test of the own systems forces an used external Web service to its knees.
Another option is to disable (mock) external services during a load test run. This can sometimes be useful for cost reasons, but the information if external services can withstand the expected load, is also extremely important for later operation.
As hardware during a load test run, the real, later productively used hardware should always be used for the web application. A docker container or a virtual machine behaves completely different under load, than a server at Amazon S3 or a bare metal server. In PHP applications, the IO wait (waiting for the hard drive) is often one of the bottlenecks. But virtualized file systems in particular behave very differently from real ones which operate on real hard drives or SSDs.
The hardware and the connection of the test servers, i.e. the server on which JMeter runs, are also relevant. If you don’t want to test the hosts’ network connection, we usually recommend, that you put test systems in the same data processing center as the systems, which are being put under load. The primary goal is to ensure that the load can be reliably simulated, without possibly blocking the test systems by the hosts’ DDOS (Distributed Denial of Service) detection. Secondarily, this is also a cost issue – a load test can of course generate a great deal of traffic. For example, a customer was supposed to pay several thousand of euros in traffic costs, due to the faulty routing of a host that caused traffic, which was supposed to be internal, to go through an external line. In any case, the respective hosters should be informed in advance about such tests, if possible.
Errors found
Many errors that I and my colleagues found during load tests didn’t meet the expectations of the developers of the web application. And almost all of them would have become apparent, without a dedicated load test, only during production operation.
Varnish is used in conjunction with Edge-Side Includes (ESI) to cache individual parts of the website with different cache contexts and runtimes. This was used very granularly on a large online shop and it worked wonderfully during the development and the usual tests. However, due to the very granular use of ESIs and the combinatorial explosion of the cache contexts, Varnish could no longer keep all necessary variants in the memory during the load test. A cache hit rate of < 10 % meant, that the PHP framework for the online shop was requested not only once for the entire page, but up to forty times for a single page view of a visitor. This large increase in requests was far too much for the application servers. However, the problem could be solved relatively easy by a strong reduction of the ESIs.
NFS (Network File System) is often used in web applications to synchronize static files between several application servers. But NFS often behaves very differently under a high load than under a low load, because multiple parallel write accesses very often lead to complete blockages which can last minutes. This is an effect, which does not occur in normal tests, but it can be observed quite often under load. By the way, this can be avoided by writing NFS shared files only once and never changing them again. Multiple reading servers are usually no problem.
A cluster pre-configured by a hoster had another problem ready for my team, which would have caused a lot of errors in the production operation, but was not noticed in the test operation. The Apache server simply accepts about twice as many connections as the MySQL server. This resulted in 50% of all queries to end with an error, because no connection to the MySQL server could be established anymore. It’s actually a trivial problem, but one which can cause a relaunch or an advertising campaign to fail completely.
In none of the cases we tested, was the MySQL server too slow, which is the most common assumption of the developers. With the exception of one case, the systems we have tested so far, would never have withstood the announced load. However, after the tests, measurements and corresponding troubleshooting, every system has so far survived the planned event without any problems. Even if the investment in such a load test, either by building up knowledge of one’s own or by external experts, seems large for the time being, it is worth it again.
Checklist
A checklist can help to identify the most important points, before a load test is carried out:
- A determined hardware for the test server: The tests should never be run on the system, which is supposed to be tested – this would strongly distort the measurement.
- Sufficient test hardware within the same data processing system: Both the network throughput and the load should also be measured and monitored on the test servers to ensure that the announced load can be reliably generated.
- Testing the actual hardware: There is no way around the testing of the actual hardware, if you are in need of meaningful results. Infrastructure automation (Ansible, Puppet …) can help to duplicate possibly existing system.
- Use realistic data: The data sizes and structures within the tested software should be as close as possible to the realistic environment. Especially the size of the index in databases and their respective storage consumption are often crucial when it comes to the performance of the respective system.
- Inform external service providers: In any case, all operators of integrated external services, which are also tested, should be informed. Often it has to be agreed on how to deal with the data arising during the test period.
- Defining realistic user scenarios: The significance of a load test stands or falls with the realistic user scenarios. These should be worked out together with the product owner. It is also important to understand the number of actions that occur.
Conclusion:
Setting up and running a really meaningful load test is more work than calling a short script. In return, such a load test can give you the certainty that an advertising campaign or a relaunch can withstand the expected user numbers, and it allows you to plan the necessary hardware much more precisely, which can reduce costs in the long term. In the end, a failed advertising campaign is often more expensive than a test can be in advance – but the security and confidence that a meaningful load test gives is priceless.